Business owners all over the world have been practicing performance budgeting for years, some stick to it as it seems pretty much rewarding to their respective businesses.
However, all of them are not financially equipped enough to maintain performance budgeting standards, they can still adhere to a set of practices for at least not crossing certain lines.
We’ll discuss why is it a concept so widely inculcated by website producers.
What is performance budgeting?
A performance budget is a set of value limits which take care of website performance. Your development cycle and design team should inculcate practices which help in maintaining these value standards. For instance, setting a threshold for the total size of the uploaded images, size of the pages or even the weight of HTTP requests being generated out of your webpage.
Performance budgets have been known to gel design and development. It establishes a performance culture for your in-house environment. As per Tim Kadlec, the innovator of performance budgets - “performance should be one of the first things a team considers in planning a website.”
Why is a performance budget necessary?
You are probably reading this because your business has suffered due to your site’s ineptness. When you maintain a set of performance standards, you set the bar high.
What should you require to maintain your fist in the market is a solid strategy, for tackling performance-related metrics such as page load time, visually complete time, and etc.
Your end consumers, as per statistics, will abandon the website if it doesn’t load in less than 4 seconds. While there are a lot of factors which make an impact on load time, such as, page weight, the size of the webpage in kilobytes including all the retrieved assets (images, videos, styles, scripts), and the weight of HTTP requests etc. You might want to set the bar high for the micros.
When these fragile elements meet the set standards, it will certainly result in providing expected results, such as a Time to First Paint of less than 1 second, which in fact meets Human-computer interaction guidelines.
Having a predefined performance budget, set out early in the project and before any actual designing begins, you have a structure to gauge your design decisions against.
An added advantage is that the performance budget helps explain to stakeholders why certain features have been omitted or changed.
What does Drupal performance budgeting look like? / Performance budgeting ideas.
Having an idea of what a performance budget might look like, should probably give you a head start. Primarily, the people involved in practicing the budget should be your UX designers, Site developers, and graphic/visual designers. Take a look at the elements you can set boundaries to:
-
Maximum page weight totals
-
Total weight of HTTP requests
-
Setting a benchmark score using Google speed index
-
Limits on segmented scripts like Javascript, CSS, and web fonts used
-
A limit to the size of images that can be uploaded to your website
-
Total load time to not exceed 1 second
-
Time to render or time to first paint should not cross a 2-second limit.
These are a few instances of performance budgeting which you should incorporate into your development environment to ensure you are not losing potential conversions or gradually improving or maintaining the user experience along with time.
While these elements may fluctuate depending on the compatibility of your hosts, you might want to check up there as well.
A breakdown:
There are obviously too many metrics to cover, it sure to get confusing to categorize. Prioritising performance over design might give a direction to the designers and will be in the favour of your end users. Here are a few categories to pay attention to:
Milestone timings
Metrics which are time-based, mostly fall under milestone timings, a definition by Pat Meenan. Your website’s performance is dependent on many equally important time bound metrics, they own the lion’s share in delivering a stunning user experience.
Some examples of milestone timings are Page load time, Time to render, and domContentLoaded.
Here’s the catch
One page takes 3 seconds to fully load but displays nothing to visitors in the first 2 seconds of the session. Whereas, another page might start rendering and display content to the visitors in the first second while it loads the actionable in the background for another 3 seconds. Here, the latter is definitely is a better user experience than the prior. Users have got to be served with the visuals, the moment they make a hit to your page and begin a session.
SpeedIndex tool shall help you perform a better check into how fast is the page being rendered and how much is the current load time for the entire page, which will allow you to take proper actions in terms of reducing the size of the page or further compressing the uploaded images on the web page, to shrink the load time.
Quantitative metrics
There happen to be a few metrics which don’t help you measure user experience in any form but definitely take a huge bite of the overall performance factors.
Some examples of quantitative metrics being, Total image weight on the web page, total media weight, total number of requests, and the overall page weight.
These are the foundation of a performance budget you are about to devise. They are much easier to conceptualize during the development cycle.
A quick use case as provided by Daniel mall- “The layout and graphics proposed by your graphic designers might not be so fruitful for end-performance.”
For example, the proposed design might require the size of the home page to be exceeding 2 MB. After integrating your performance budget into the design phase, which demands your homepage to not cross a 1 MB mark, the proposed design, used resources can be repurposed to shrink the size way further in order to meet performance constraints.
Speed index
Until now, the traditional metrics have been focusing on a single moment, SpeedIndex, on the other hand, focuses on measuring everything related to the user experience. You might want to have a score of how long it took every single element to load as soon as a session begins.
It was designed to be an abstract score.
Speed Index is still to be understood by any experts in the development field. It is quite tough to be grasped. A page which has an excellent render time might be scoring lower on SpeedIndex. The lower the better, yes!.
In simpler words, from the time the processes start, till they finish, how does the page behave during those respective intervals.
To maintain a good score, there are two critical aspects you should look at: Optimising content efficiency and optimizing the content rendering path. Here is an example of optimized and unoptimized rendering.
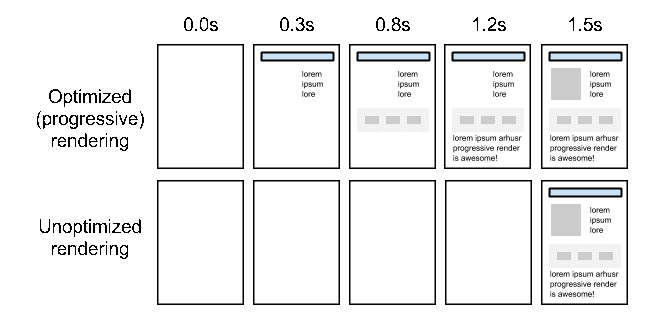
What adds to the load time are the tons of resources required to fetch the complete application, achieving superb content efficiency may lead to great rendering and an impressive speed score.
Rule-based metrics
There are numerous tools available for free to let you assess your page’s efficiency by providing you an in-depth analysis of the respective pages.
Some industry standard ruled based tool are: Yslow score, GTMetrix, Google Page Speed score and many more.
You can avail an insight into whether the page size is optimized enough to not hamper the load time, whether the images are compressed well enough or not. Even though they are not directly related to user experience but it is always a smart move to incorporate these score thresholds in your performance budget.
The metrics worth enhancing
First meaningful paint
First meaningful paint is the most revamping layout change which happens after the fonts have completely loaded.
Hero rendering times
Hero rendering times is a combination of multiple occurrences like the largest image, banners, H1 in the viewport have been rendered.
Time to interactivity
This metrics monitors when the page is ready to take inputs, such as clicks, button press etc.
First Contentful paint
A metric to measure in what time did the browser first render content on the page like images, text, background images or SVG.
Perpetual speed index
PSI shows how quickly the content of any page is visible in the start of a session. A lower perpetual speed index is always recommended.
How to prepare a performance budget?
It is crucial to know/plan your content in advance and be aware of what’s going to be there on your pages. You might want to establish a target page speed, conduct due research and make appropriate estimates for the page size which might best suit your speed benchmark.
The most important aspect is to keep reviewing your budget and make sure development practices align well to the budgetary requirements.
An example goal and estimation for a better understanding.
Supposedly, you plan to have a fully loaded time of 3-4 seconds, so the content composition of your web page must be in accordance as well. You might be able to hold 4 large images with 2 webfonts at the same time.
A way to help establish goal figures is to have a peek into your competitor's statistics and try to set lower time constraints. Another way to do it is by following the industry standard metric specifics and always keep the bar lower than recommendations.
A performance monitoring tool Webpagetest helps you analyze the loopholes, you should be recording a few milestone timing elements such as Start Render, Document complete, and Fully loaded time, as in the examples:

Now that you have your scores in line, it’s time to plug in competitor urls and record the same milestone timing metrics to get an insight and set your own standards:

You can now set a target time for the above three metrics, for example
- A start render time of 1.126s
- A document complete time of 3 seconds or even less
- A fully loaded time of less than 4 seconds or less.
It is time to identify what is the very least of connection speeds do your end consumer use? You can easily find it out through your embedded analytics software.
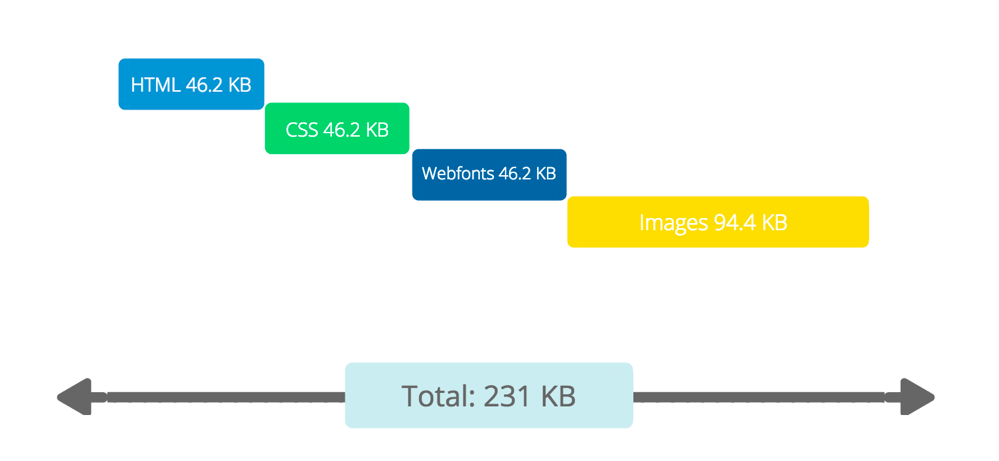
As the the poorest connection speeds, you can assume a transfer speed and accordingly curate your page weight so that it falls in line with your document complete time. With the target page size in place, you now know how much space can be allocated to every proposed feature. Size allocations are adjustable in fact, for example:
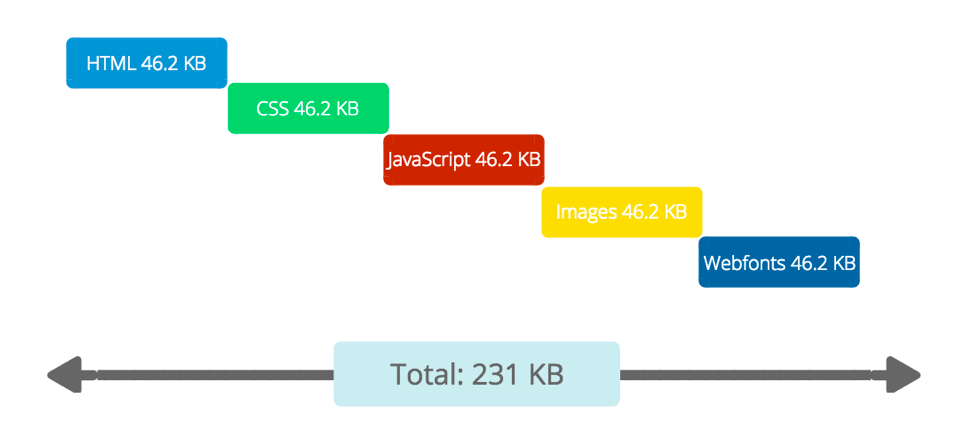
Refined size allocation, as JavaScript doesn’t play the most crucial role in rendering the web page, it would be better to assign the space to images which were planned in the earlier proposal.
RAIL: A user centric budgeting model
Response, Animation, Idle, Load, is budgeting model which brings the users back to the centre of attention.
A brief:
- A users actions are broken down into elements like tap, scroll, drag and load
- It provides performance goals for these actions, for example, tap to paint in under 100 milliseconds.
Certain thresholds you need to set
- Respond to a users action within a 100 millisecond time frame and they will feel a sense of immediate response. A longer time would certainly break the emotional connect the user felt between their action and the provided response.
- Animation is quite the pillar of modern websites, from scrolling to transitions. And users expect very smooth responses from animations. While you should respond to a user’s actions in less than 100 milliseconds, to animate appropriately, every frame of the animation must be delivered in less than 16 milliseconds, hence achieving 60 frames per second.
- Bootstrapping the comment functionality, initialising components, searching and storing data, etc. do not require to be done in the response or load time frames. They can be executed separately when the browser enters an ideal point, which by the happens frequently when a user switches tabs.
The business impact of RAIL
Several multinational organisations have used the RAIL methodology and their businesses have certainly felt the dramatic impact:
- Google: A 2% slower full load time leads to 2% fewer user searches
- AOL: Faster pages generate more pageviews
- Yahoo experienced 9% more traffic after they made their page just 400 milliseconds faster
- Amazon generated 1% more revenue after they made their page 100 milliseconds faster
- Google itself using website speed to assign search engine results position
- Aberdeen group’s page got one second slower and experienced 11% fewer page views and 7% fewer conversions.
Action on the budget now
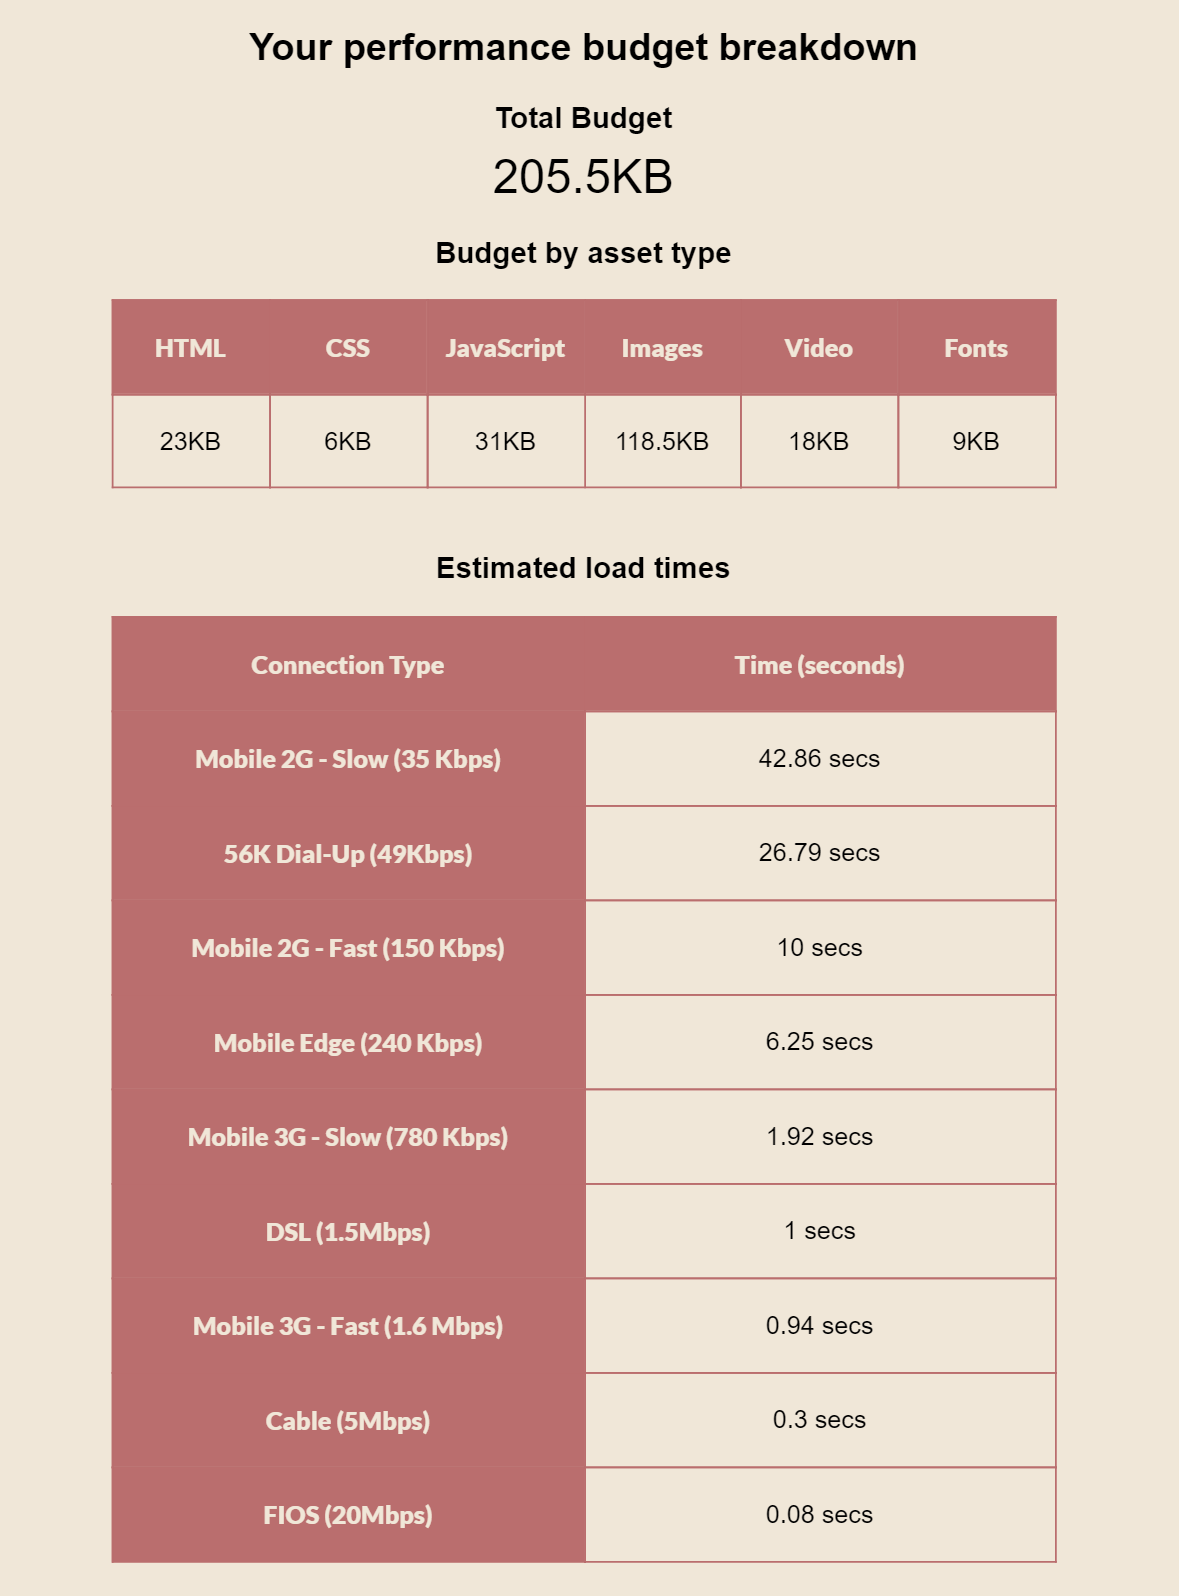
There are a few tools to help set up a performance budget, one being free by Jonathan Fielding:
All you might need to do is just enter how quickly do you want your pages to load on a connection variety.
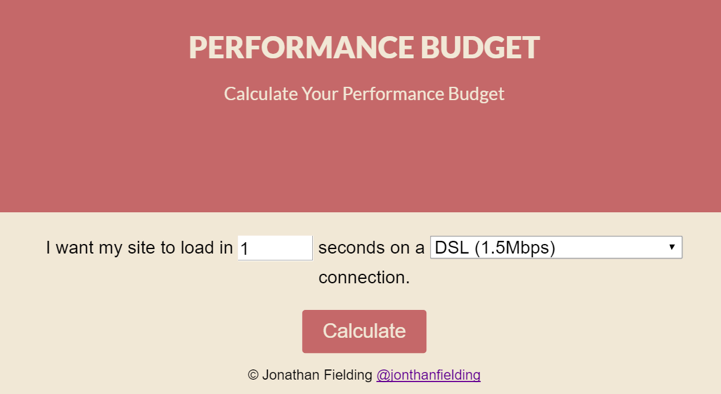
In the second step, you can change the sizes of your HTML, CSS, JavaScript, images videos and a few more to meet your performance budget standards.

You have a breakdown. Your development cycle should inculcate these set thresholds to meet speed constraints set by your budget in place
Website performance should be budgeted from the very start of a project and practised religiously to ensure satisfaction. The compromises don’t have to be too performance-centric but using one font instead of the other or using one image over the other.
We at OpenSense Labs can also help you set constraints as per your website scale. If you are finding it time-consuming to monitor and control everything, feel free to speak with us at [email protected] regarding performance tuning, we always love a word.
Subscribe
Related Blogs
What’s New in Drupal CMS 2.0: A Complete Overview

"Drupal CMS 2.0 marks a significant change in the construction of Drupal websites, integrating visual site building, AI…
Drupal AI Ecosystem Part 6: ECA Module & Its Integration with AI

Modern Drupal sites demand automation, consistency, and predictable workflows. With Drupal’s ECA module, these capabilities…
Inside the Drupal AI Summit: Themes, Speaker and What To Expect

“ The web is changing fast, and AI is rewriting the rules. It writes content, builds pages, and answers questions directly,…


