If you are into coding the word debugging would sound familiar to you. For me, without a debugger time involved in fixing a bug or an error will significantly rise. Having debuggers would reduce the hassle of writing print statements or echos in our code effectively cutting down the bad looking code.
In this article, we’ll configure XDebug on our servers. I will explain how we can do it on MAMP, it is pretty much same for all the servers and after that, we will see how we can use the debugger for VScode and Brackets. Why no other editors? Because Drupal website already showed how to do it on other code editors and IDE’s like PHPStorm, Vim etc.
So, what is XDebug?
It’s a tool used to debug PHP. Sounds, simple enough and so is setting up. Let’s get started…

Configuring XDebug
It’s actually pretty simple. You have to add or uncomment a few lines in your php configuration file in the server that is the Php.ini, a thing to note is that a server might contain different configuration files for different PHP version don’t edit the wrong one. What do I mean? Hold on we will come to that too.
First, we are going to see how to do it on a typical server I am going to use MAMP. It is my local server running my Drupal. It still going to work if it’s still not Drupal, of course. The point is to get the debugger up and running. So, go to the server folder it Is the place where the application is installed.
Go to search and type “php.ini” we have to add or un-comment couple of lines in to this file... check the version of PHP while opening the file if you edit the Php 5.1 version and run the server on 7.1 it won’t work and you’ll end up leaving a comment like ”you suck!”. Edit the file in the conf folder, I highlighted it.

I am going to edit the PHP 7.1.5 open it with your favourite text editor.
Search for XDebug in the PHP file, if you find the lines below commented uncomment them if you don’t add them.
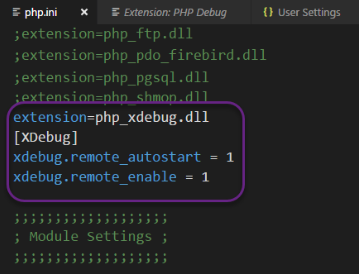
Here is the code, add it if you don’t have it commented.
extension=php_xdebug.dll[XDebug]
xdebug.remote_autostart = 1
xdebug.remote_enable = 1
Don’t forget to save and exit the file.
For Acquia-Dev Desktop
This is Drupal specific you can skip this if you don’t need it. Let’s see how we can do this in the Dev-desktop.
Got to Acquia Dev Desktop in the top menu and select settings. Got Config and edit the php.ini and again look out for the version number you are editing, edit the version of the file that your site or server runs on.
It opens the file in the native text document, in windows notepad.
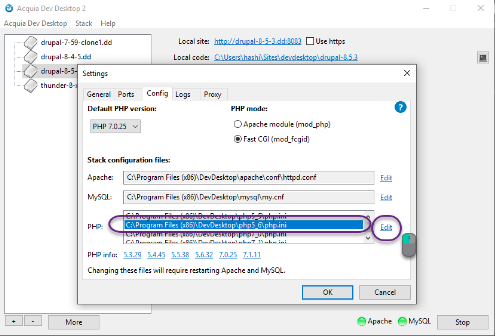
Search for XDebug if you found the following line, make them uncommented or just add them if didn’t find them…
zend_extension="C:\Program Files (x86)\DevDesktop\php5_6\ext\php_xdebug.dll"
[XDebug]
xdebug.remote_autostart = 1
xdebug.remote_enable = 1
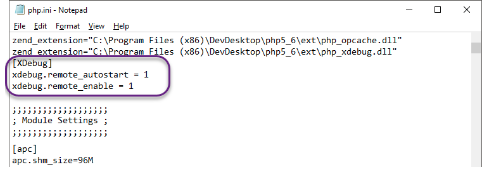
Save exit the file, you are good to go. You’ve set up the xDebug on the server let’s see how we can use it in the text editors.
Setting up in text editor
I am going to set it up in the In the Visual Studio code and Brackets for other famous editors and IDE I provided a link in the reference section to the Drupal site. Don’t worry… now, let’s set it up in the VS code.
- Edit the setting… add the following lines to the setting…
{
    "php.validate.enable": true,
    "php.validate.executablePath": "C:\\MAMP\\bin\\php\\php7.1.5\\php.exe",
    "php.validate.run": "onType"
}
That path should be your php path, also check the version number…
- Add XDebug helper tool to chrome, it’s a great tool for debugging
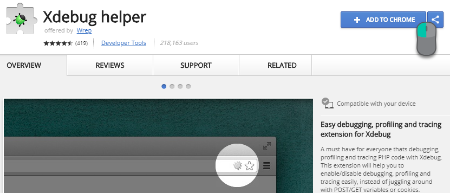
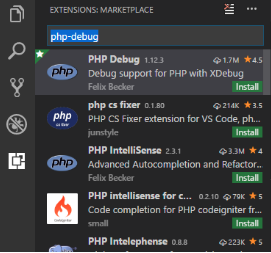
Go to extension and install search for php-debug and install it, the php debugger.
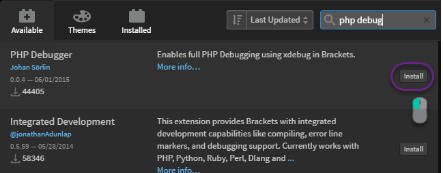
Since we are on point of installing extension this is where brackets editor comes in it have an extension as well. Go to extension and type php debug and install the extension.
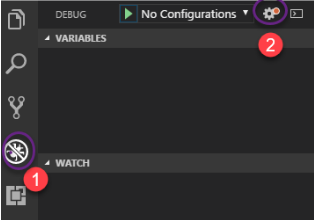
You are good to go, one more thing is that you have to set the configuration, i.e you have to set the port on which it’s running in the configuration while running in the VS code. Go to debug and click on setting and type php and set your port there…
You are done good luck in fixing bugs, errors. Now, go save some time with the debugger.
Drop a comment if you failed to understand or run into any problem.
Subscribe
Related Blogs
Workforce Management Tool: Features, Benefits & Complete Guide
“Simply Manage is a workforce management tool designed to streamline workflows across teams, making time tracking, resource…
Trek n Tech Annual Retreat 2025: A 7-Day Workcation of OSL

OSL family came together for the Trek n Tech Annual Retreat 2025, a 7-day workcation set amidst the serene beauty of…
Exploring Drupal's Single Directory Components: A Game-Changer for Developers
Web development thrives on efficiency and organisation, and Drupal, our favourite CMS, is here to amp that up with its…


