
Big Data Strategies: Advantage Media and Publishing Companies
"Information is the oil of the 21st century, and analytics is the combustion engine” - Peter Sondergaard, Former Senior Vice President at Gartner
With the world getting more deeply and digitally interconnected, there is an enormous scope for harnessing personalised data for optimising modalities in multiple domains. The impact of Big Data trend can be seen in every other industry including media and publishing sector. New technologies are being developed for automating and streamlining the process of data analysis. Throngs of data analysts are being trained and hired to meet the ever-increasing demand for the analysis of these data.

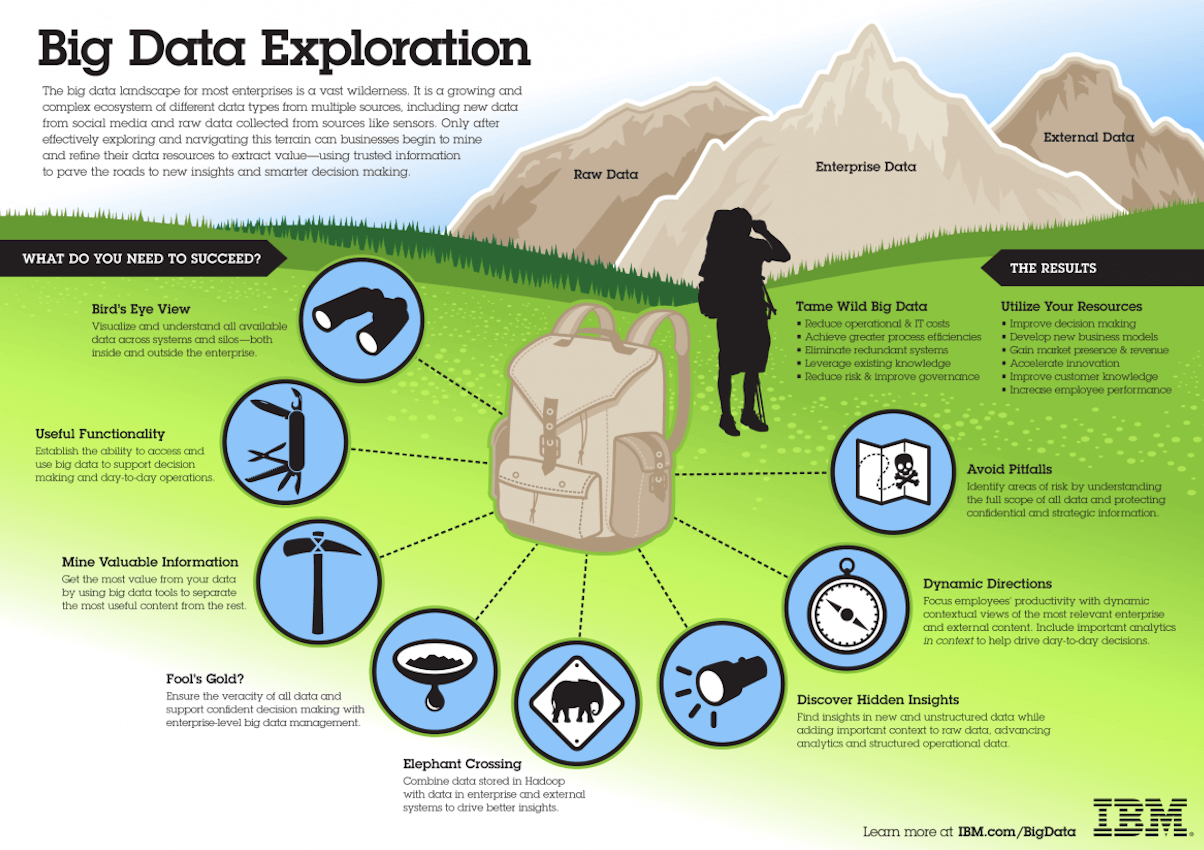
For newspapers, TVs, magazines and Internet-only publishers, Big Data strategies can include audience analytics for enabling better understanding and targeting of customers. There are tools to understand public and private databases for journalistic storytelling. Also, there are tools to manage and search the cornucopia of videos, social media and other content. Tools are also available for automating the production of text and video stories. And much more!
Hold on! So, what is Big Data again?
Gartner defines Big Data as the “high-volume, high-velocity and/or high-variety information assets that demand cost-effective, innovative forms of information processing that enable enhanced insight, decision making, and process automation”.
"Big Data refers to high-volume, high-velocity and/or high-variety information assets that demand cost-effective, innovative forms of information processing that enable enhanced insight, decision making, and process automation"
The concept picked up momentum in the early 2000s when the industry analyst Doug Laney articulated the three Vs of Big Data:
- Volume: With big data, you will have to process voluminous amount of low-density, unstructured data.
- Velocity: It is the fast-rate at which data is received and perhaps acted on.
- Variety: It refers to the different types of data that are available like structured, unstructured and semistructured data types.
In the recent years, two more Vs have popped up namely, value and veracity. Data has intrinsic value but it is of no use until that value is discovered. Also carries the equal weight is to know how truthful your data is and how much you can rely on it.
Today, big data has become capital. Just think about some of the world’s largest tech companies. A large chunk of the value that they offer comes from their data which they are constantly assessing and analysing to produce more efficiency and build new products.
Big data for media and publishing companies
Media and publishing companies collect reams of data every minute from different areas of their organisations. These areas can be advertising/sales, content, account, readership/usership/membership and more. They also produce stockpiles of data in the form of videos, images, text and graphics.
Media and publishing companies collect reams of data every minute from different areas of their organisations.
The Big Data conferences have produced some priceless lessons for media and publishing companies with aspirations in engaging in Big Data strategies. Here’s what some of the companies who have benefitted from Big Data have to say in these conferences.
The HuffPost story
The HuffingtonPost.com news media, had 22 million monthly visitors to 11 global editions in 2014 and 16 more editions were to be planned by the end of 2015. Jimmy Maymann, the then CEO of HuffPost, followed the mantra, “It’s all about the data”. HuffPost used Big Data to optimise content, authenticate comments, ensure efficiency of native advertising, regulate ad placement and build passive personalisation.

Content optimisation
Maymann said that Big data enables more precise analytical approach to decision making to improve user and advertiser experience. A real-time statistical dashboard and analytics platform powers HuffPost’s complete editorial process, he stated.
For instance, HuffPost headline writers tested the positive impact of headlines in driving readership with A/B testing. Maymann credited the A/B testing with significantly higher traffic on stories. He also stressed on the importance of serving content at the right time and on the right kind of device to the right set of audience.
Through the assessment of Big Data on its parents’ section, they could determine which of the parents, who typically accessed content on their mobile as opposed to their desktops, are active online on weeknights. So, to reach this audience, they published content when parents are online which revved up traffic to stories of interest to parents, Maymann said. One of the HuffPost’s parent blogs, 10 Ways Living with a Toddler is Like Being in Prison, received 24,000 views in 7 hours and almost 41% of the views were due to social media referrals.
Comments authentication
HuffPost content garnered 300 million reader comments back in 2013. Maymann sought the services of Big Data analysis to understand how the user experience can be improved through authentication of readers’ comments. HuffPost held a conjoint analysis which is a statistical technique used to determine how users value the features and functionalities available in a product or a service.
The conjoint analysis helped in determining whether the quality of comments coming from an unknown person or those who have identified themselves by name or by avatar and from a certain location. The analysis showed that the quality of the comments were better than the ones who were regionally closer to those surveyed and from those who were not unknown.
The findings pushed HuffPost to get the commentator registration and disallow unknown postings, Maymann said. “We are getting rid of the bashers, and now have higher quality of people commenting, even though we took some heat in the press for [ending anonymous comments],” Maymann said.
Thus, by employing Big Data analytics, HuffPost were able to determine that the site’s native advertising were getting higher brand recall over sponsored content. They were also getting higher brand recall over standard medial.
Assisting advertisers to meet regulations
HuffPost leveraged Big Data to flag possible violations of proximity between pharmaceutical ads and related editorial content. The word search function identified sensitive words that violated the pharma regulations thereby triggering the blocking of ads in proximity to the content, Maymann said.

Passive personalisation
HuffPost used a technology of one of its mother company’s newest assets to identify individual user interests via browsing behaviours. This helped in connecting the right content to the right people through passive personalisation. Maymann stated that “interest graphs are derived from algorithms that identify user-level interest data. This is a snapshot of all the interests all of the visitors are interested in; you can see how much depending on size of circles. What is driving engagements on sites? This tells us what we should double down on”.
The Financial Times story
Data has been instrumental for Financial Times. It gives credit to the collection of registration data that was done through its metered paywall. The collected data has enabled the FT to serve the customer better, build targeted advertising campaigns and create new products on the basis of data compiled on background and areas of interest to its readers.

“Five or six years ago we started a new media model, charging for access through a metered system. When we started doing that, it was primarily to build a revenue stream online, but probably what was more important over time was the data and customer insight that that gave us. That’s what transformed the business,” said CEO John Ridding, according to an April 2014 Mashable article.
Tom Betts, Chief Data Officer, said that news consumption patterns are shifting and now subscriptions to FT.com outstrip subscriptions to the FT newspaper. The data collection has helped to grow digital subscriptions by leveraging a better understanding of the customer. With the data that were collected, FT built signatures of digital consumption on their reader’s consumption of content. This helped to:
- Understand customer content preferences
- Enhance the relevance in FT’s communication to customers
- Personalise content
- Deploy intelligence to customer touchpoints
Data has intrinsic value but it is of no use until that value is discovered
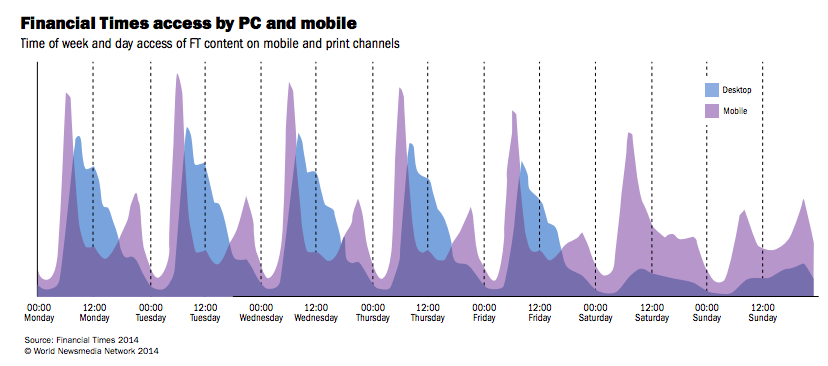
The addition of mobile channels constituting tablet and smartphone platforms contributed a level of intricacy to understand each FT customer. For instance, content might be consumed on smartphones and tablets during the weekends while management or finance related content might be consumed on desktop in office on weekdays.
“A multichannel view gives us unique context about customer needs and behaviour,” Betts said. The profiles are helpful to build personas for which to develop new FT products, for instance, a retail executive with plenitude of discretionary income for luxury and travel. Or, a young middle manager with high objectives for getting promoted up the ranks.
“Baked into this segmentation is engagement, not just engaging the most likely subscribers,” Betts said. “[Segmentation] is helping us with product development.”
“What are the implications for a daily newspaper with 126 years of history? That brings ways of working and process. We now have to look at the way things are and evolve. Should we publish in the evening [to meet the demands of the reader]?” Betts said. “There is a disconnect when you are publishing and when they are consuming. We must think more like a broadcaster with the programming mindset. We need to optimise to meet these demands.”
To those media companies who are starting out on a Big Data strategy, Betts has a piece of recommendation:
- Using customer-centric approach, bring your data to life
- Obsess about data capture
- Do not be dogmatic about data use and tools
- Break free, break misconceptions and get stuck in!
The Sacramento Bee story
The Sacramento Bee took a systematic approach to Big Data strategy. With an objective of positioning itself for the future, the American newspaper company went head-on with Big Data challenges from perspectives:
- Technological systems
- Customer analytics and tracking
- Business models
- Culture issues

Each of these areas depicted tactical challenges such as data visualisations of audience and financial data. It also presented enterprise issues such as the company’s individual content profiling system that emphasises on learning more about online visitors.
Darrell Kunken, Director of Research, remarked that “it’s all about our content”. Kunken said that effort has been put in to identify areas that are impacted by data and to apply the tools to visualise the data for making it useful. Among the areas to deploy data visualisation tactics were auto dealer sales, small and mid-size customers, shopper trends, and path-to-purchase data for advertising sales materials.
The Bee mapped where current and former subscribers live and Corporate Performance Management (CPM) reporting for business administration support materials. Audience analytics helped the news department in understanding how long readers engaged with stories.
The Bee leveraged data visualisation technology called Tableau to visualise data for car dealers in the Sacramento market. This helped in showing them how they ranked among competitors in vehicle sales.
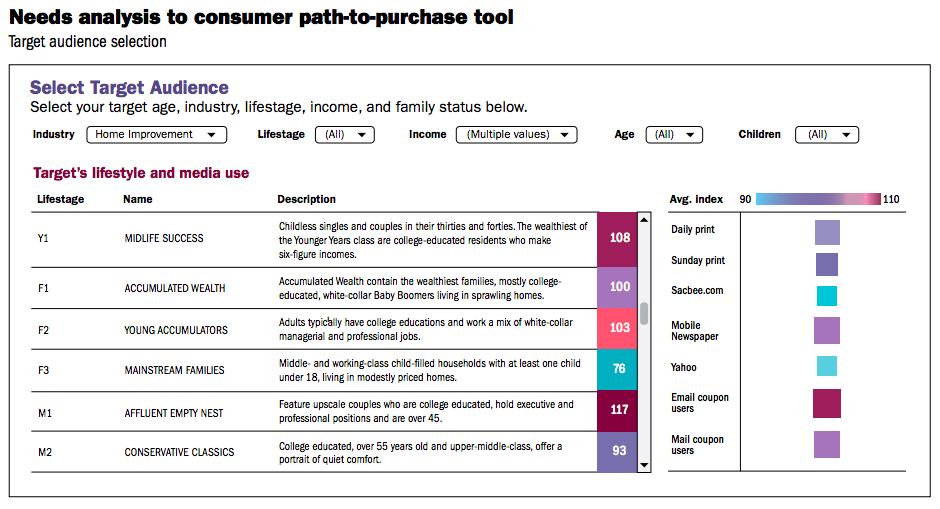
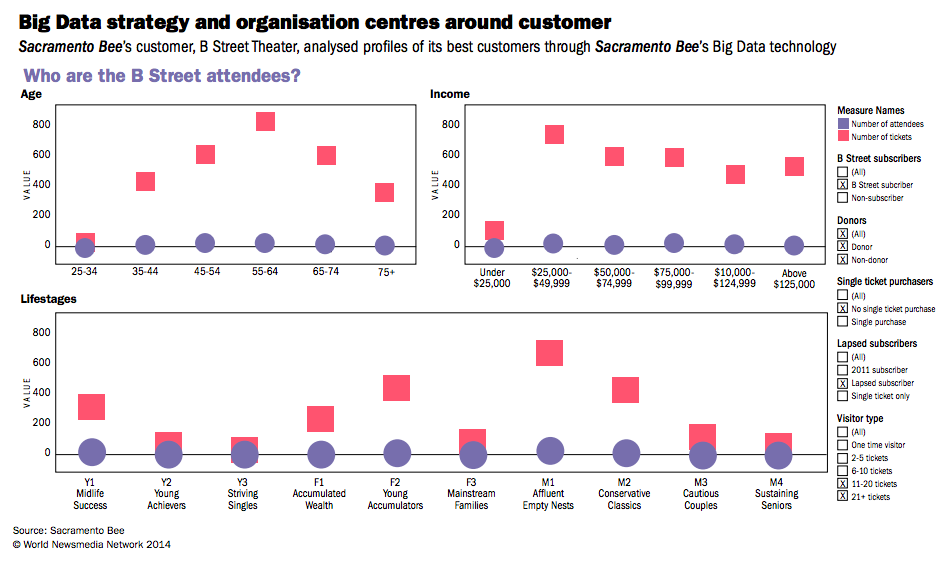
Big Data has enabled the Bee to build an elaborate path-to-purchase visualisation tool to help advertisers target demographic and special interest groups. It worked with local businesses’ data and assessed it to show the owners their best customers, theri demographic breakdown and their geographies.
Conclusion
So, where are we heading with so much data? Is there any future of so much reliance on data where a lot of spurious correlations dominate our lifestyle and livelihood? Big data technology is essential to get deeper insights and understand data better. Journalism can benefit a lot with the incorporation of Big Data strategies thereby streamlining the workflow of media and publishing companies.
We, at Opensense Labs, are always in the pursuit of bringing a wholesome digital experience to your organisation that proves game-changing for your business. Reach us at [email protected] and let us know how can we help incorporate Big Data strategies in your business workflow.

Join Our Newsletter
Love open-source tech? Stay updated with projects that make a difference.