
HowTo: Use Charts Module in Drupal

Gaurav
Drupal
Published on 09 Jul, 2018
3 min read
Business reporting is not easy. It is a tough task to update every information and report again and again. If you find yourself caught in the system of posting long reports on your website, then perhaps the Drupal Chart module is for you.
Everyone loves infographics, in fact, 65% of people are visual learners. Adding charts and graphs is another way you can make your data interesting. If you are a Drupal site owner then it is quite easy to add the chart to your website through UI. You can use the Chart module.
In this article, we will learn how to use the chart on a Drupal website to visualize the data in a better way.
Charts Module: Charts Module transforms the Data into visual information and can help visualize a lot of data in a way that can be quickly digested.
Here are some features and facts to use this module:
- Supports Line, Bar, Column, Pie, Area, and Scatter type of Charts.
- Displays the Views results in form of a chart.
- Includes a lot of example charts, these can be referred to build your own chart.
- Creates charts in an easy way, this module provides Drupal-friendly syntax instead of underlying library.
- Using this module, you may also use the Highcharts (HC) and the Google Charts (GC).
If you are a Drupal 8 user then as an additional feature you are getting a modular structure to make it easier to contribute new charting libraries without changing in the core Charts module.
Here's how you can add a chart to your Drupal site.
- Install the Drupal Charts module and enable it.
- Create a custom content type and add a field to it, which you want to show on the chart.
- Go to Admin/ Structure/ Views/ Add/ New view/ Block display setting as an unformatted list. Select the content which you have created. Click on save.
(Make sure you don't choose the chart option otherwise you will be stuck with a validation error)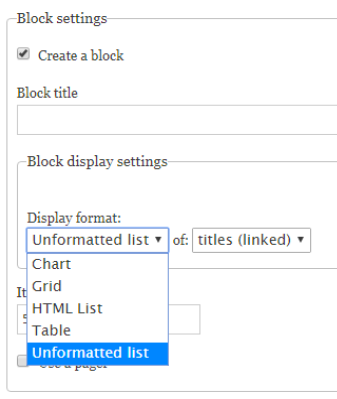
- If you want to use the aggregation then enable it, yes. Go to Advanced/ Enable.
(Enable this setting only if you need aggregated values)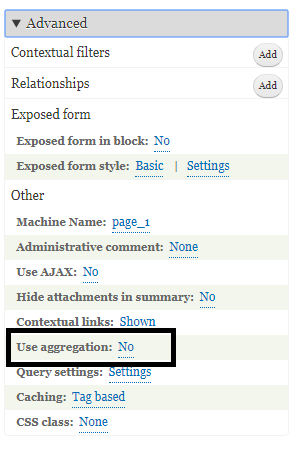
-
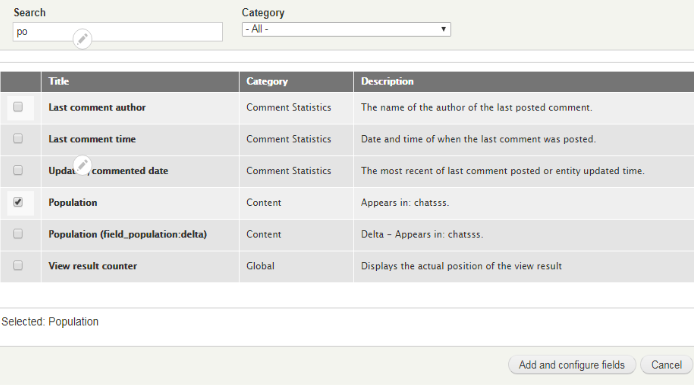
Add the fields on the same page in the Fields section. Choose the field which you have created in your content type. And click on Add and configure field.
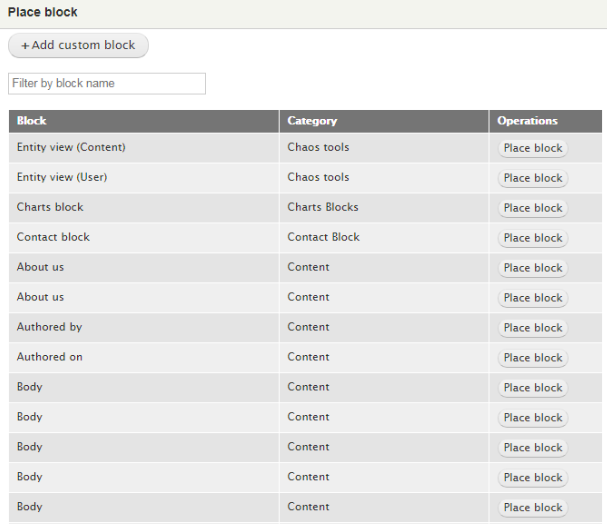
- Place the block in which you want to see the chart. Choose the chart block and place it where you want to.
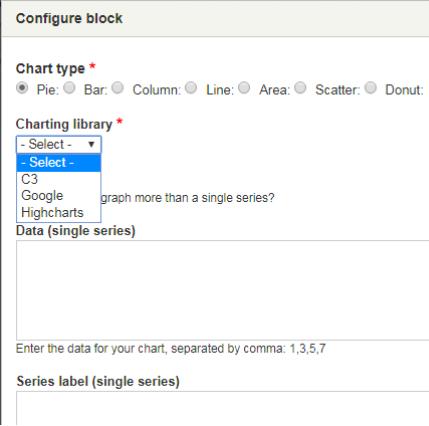
- Configure your block using the drop down chatting library. And click on Save.
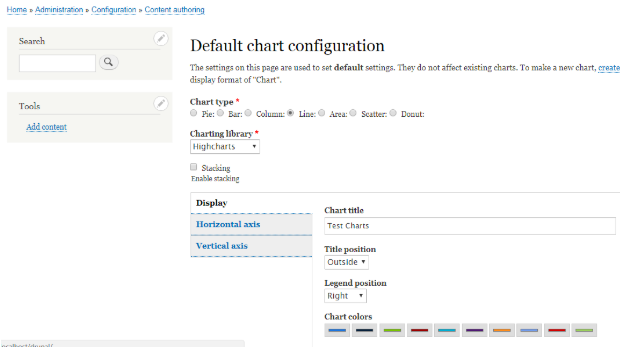
- You may also change the default settings. Go to Admin/ Configuration/ Default chart configuration and change the settings according to you.
-
Now add content to the content type ‘chart’. And Save it.
-
Go to the content you have created. Your chart is ready. So this was how you can add a chart to your Drupal site using the Charts Module.
Let me know in the comments below how you used the charts module.
Subscribe
Related Blogs
Inside the Drupal AI Summit: Themes, Speaker and What To Expect

“ The web is changing fast, and AI is rewriting the rules. It writes content, builds pages, and answers questions directly,…
FOST and Drupal AI Initiative: Next Era of Responsible AI

Three years after the launch of generative AI tools marked a new age for artificial intelligence, almost 90% of survey…
Drupal AI Ecosystem Part 5: AI Content Suggestions

Drupal has steadily evolved from being just a content management system into a flexible platform that incorporates emerging…