The last few years have seen a major shift in the application development process. With the emergence of trends like Agile and DevOps, the whole scenario for the development of application software has changed gradually. Organizations are working head over heels to deliver new software or an Internet application in an innovative way keeping the speed of development up to the mark. This has helped organizations to achieve the utmost outcomes with no wait-in timer for days, weeks or longer durations for new applications to break out of the application development bottleneck.

Moreover, organizations are now choosing cloud-native application development methodology over the traditional approach. Cloud infrastructure and containerization technologies have brought new distributed system designs in the picture, called as Microservices. The majority of microservices are involved in large applications building, rapid provisioning & deployment through decentralized continuous delivery, utilizing condensed DevOps practices.
Comprehensive service monitoring is imperative for efficient development, maintenance and operation of such applications.
32% of new applications planned for getting developed for many enterprises by 2020, a rapidness will be seen in embracing the cloud-native application development techniques in the coming years. - The Economic Times
Let’s dig deep to know how cloud-native world can be reconfigured to get successful business executions.
Cloud-Native Applications
Before moving ahead, it is indispensable to understand what actually a cloud-native approach is?
Utilizing the benefits of an extensive cloud computing model, the cloud-native approach is a driving force for building applications as microservices and running them on dynamically orchestrated platforms. It is all about the process of creation and deployment of scalable applications in public, private and hybrid clouds.
Cloud-native applications, being on-demand, with limitless computing power and presence of modern data and application services for developers has made organizations to march ahead in the market with frequent new ideas and providing a fast response to customers demands. This paradigm shift will help organizations to escalate the development process and offer avant-garde solutions.

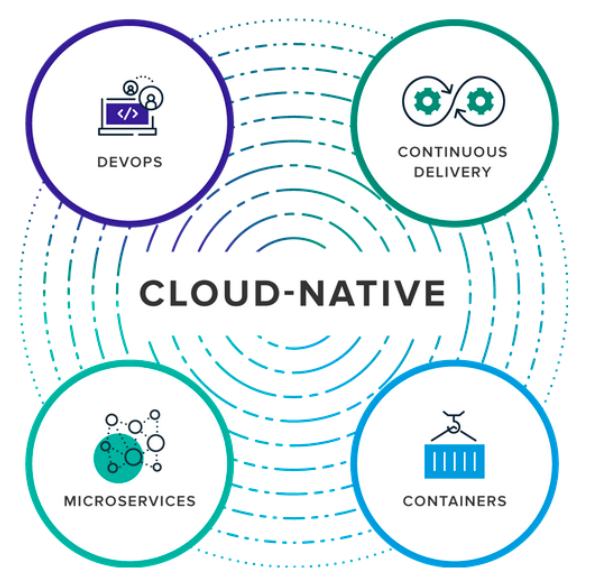
The above diagram shows four major components of a cloud-native application:
DevOps, a collaboration of software developers and IT operations with an objective of high-quality software delivery solving all the customer challenges in an environment where software test, build and release takes place in a more frequent way.
Continuous Delivery (CD), is all about transiting small software batches into the production environment in a consistent manner, through automation. CD, through Agile practice, makes the delivery of fast and better outputs to and feedback from the customers, enhancing flexibility and robustness.
Microservices focuses on the development of an application as a collection of small chunks, called services and each service implements unique business capacities, has its own process and communicates over HTTP APIs or messaging.
Containers offer a standard way for the packaging of an application’s code, configurations, and dependencies into a single project bringing, both efficiency and speed with standard virtual machines(VMs).
Monitoring cloud-native applications and the Challenges Associated
Containers, kubernetes, microservices, service meshes, immutable infrastructures and serverless has changed the way for organizations to build and operate the softwares. As majority of organizations are shifting towards cloud-native, the systems that are being developed have become more distributed and cursory.
This pattern of application architecture has brought many advantages and along with that requires a bit of change in support systems like Monitoring. As the components, the complexity of the cloud-native applications increases so do the system break possibility. An effective cloud-native monitoring strategy is needed with which such performance bottlenecks and potential issues of microservices and infrastructures are captured before they create any problem to the development teams and end-users.
To know how the application code is running inside the monitoring, it is mandatory to have a monitoring system that is capable of tracking the external behaviour like tracking the CPU usage of the host machine, referred to as Black Box Monitoring and observing the system behaviour based on the metrics defined by the internals of the system, such as logs or an HTTP handler that emits internal statistics, known as White Box Monitoring.
Cindy Sridharan states, with the increase in the complexity, gaining the clear visibility of the system’s state is quite a challenge and the majority of the failures will arise from the application layer or from complex interactions between different applications.

Cindy Sridharan recapitulates her thoughts on Observability and its relevance with container-native monitoring. Observability is an ideology that encapsulates monitoring, log aggregation, metrics and distributed tracing to gain deeper, ad-hoc insights into a system. Monitoring cloud-natives doesn't only mean to capture the metrics but its major objective is to convert them into actions increasing the customers and end-user experience. She further adds the right tool selection is vital to gain insights into the cloud-native systems.
Strategies Needed for Effective Monitoring of Cloud-Native Applications
A dedicated and composite approach is integral while doing monitoring of a cloud-native environment, covering external system scan, troubleshooting core issues, collection of tailored metrics, and tracing the related requests. Each of these components provides a unique level of insight into the system and not are required by every cloud-native architecture.
- External System Scan: An external survey of the system, known as black box monitoring is done to gain the external vision of the system, like tracking the CPU usage of the host machine. Being the traditional forms of monitoring, this strategy is very much efficient to detect the problems that are visible to the users. It has been observed that external polling offers high-end visibility of a cloud-native system.
- Troubleshoot Core Issues: Containers and servers being ephemeral, has made it important to transmit each and every log into a centralized logging system. All the systems and application logs are present at a single place gives an extra edge to the whole monitoring system. These can be configured to offer the alert for anomalous behavior, like increased log volume, unexpected error message, etc. If anything goes wrong, the centralized or core logging system gives a frequent and immediate view of everything that is happening in the system at the respective moment and provides filtered logs for specific applications, labels or messages.
- Individually Measured Statistics: These helps in gaining a clear picture of the health of the application. These metrics offer much precise information than the metrics derived from the polling data, i.e, from the outside of the system, for example, Prometheus integration with Kubernetes has enabled an easy and efficient collection of a wide variety of metrics.
- Associated Request Detection: Detecting requests is a way with which all the related requests get connected, in a cloud-native environment, by triggering a series of additional requests to the supporting Microservices. Tracing of requests offers better system visibility. Jaeger, requestsZipkin is the open-source tools determined for tracing of requests, providing detailed information about all the requests produced from an initial request together. Such information is very much helpful while diagnosing the bottlenecks of the cloud-native systems.
Monitoring alone will not offer the root causes of a problem, in order to win the game of cloud-natives, an aggressive approach is needed as a whole. Waiting for the customers to register for an issue is a fool's errand. It is always recommended to check for the availability of the application, which allows us to send out ‘alerts’ regarding applications working or crash status.
Logs for an instance, when aggregated with the other logs, give an idea of the overall health of the system. The correlated data can be very much helpful to reach the problem origin, in turn, the fixes and improvements in the respective code structure can be made.
Automation, ensuring continuity, is the process of rectifying cloud-native problems will be a boon in such a case. Proposal of resiliency tools is also said to be a better idea for the issue detection and prevention before the services and apps deployment in production.
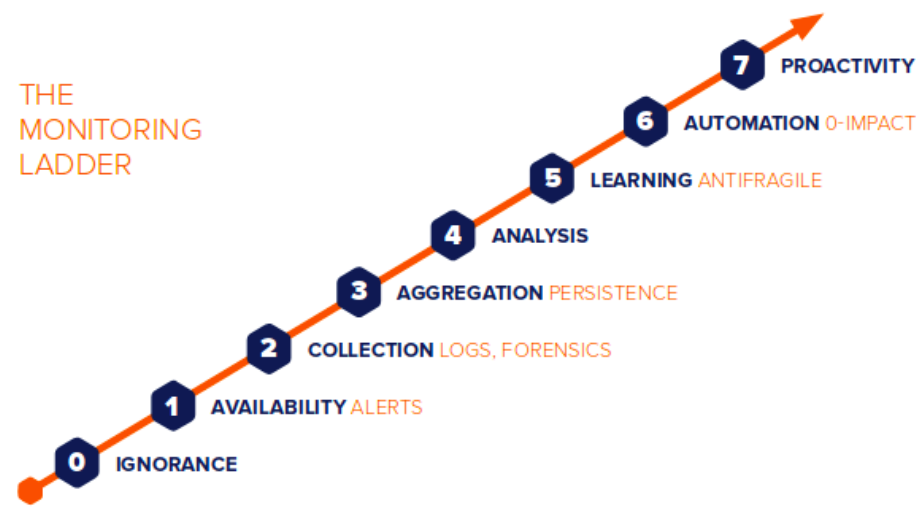
Weaveworks sums up all these additional monitoring capacities under “Monitoring Maturity Ladder” model.

Some of the Tools to Monitor Cloud-Native Applications
- Kubernetes: Google is the original designer, Kubernetes is now maintained by the Cloud Computing Foundation. Enabling declarative configuration and automation, Kubernetes is a portable open-source platform that is used to manage containerized workloads and services.
- PaaS or IaaS is the cloud services offering a Kubernetes-based platform or infrastructure as a service, on which Kubernetes can be deployed as a platform-providing service.
- Prometheus: The project is written under Go and licensed under Apache 2, Prometheus, is an open-source software application used for event monitoring and alerting. Being a certified product of Cloud Native Computing Foundation, Kubernetes and Envoy, the source code for the same can be extracted from the Github.
- Fluentd: Developed by Treasure Data, Fluentd is an open-source, cross-platform data collection software project. It performs data unification for its better collection and consumption.
- ELK Stack: ElasticSearch, deployed with Logstash and Kibana (ELK stack) is the most popular open-source centralized logging system. The components of the ELK stack provide a set of open-source tools simplifying log storage, collection and visualization respectively.
- Grafana: It is an open-source platform for data visualization, analytics, and monitoring, favored using along with Graphite, InfluxDB, and also Elasticsearch and Logz.io. Grafana offers multifaceted dashboards with panels representing particular metrics within a set time frame, that can be customized as per the project or any type of development.
- Istio: An open-source independent service mesh that offers elements needed for the successful running of a distributed microservice architecture. Management of microservice deployments gets reduced with Istio, goffering security, connectivity and monitoring of microservices.
Final Note
The advent of microservice architectures running with ephemeral containers on infrastructure is quickly evolving. Adding to the complexity, these applications are regularly deployed to multiple availability zones, regions, or even multiple clouds. This is the reason why it has become imperative to strategize and take note of the measures that can be taken for better monitoring of Cloud-Native Applications.
At the very first you must be thinking it as just like any other technology to monitor, rather monitoring a cloud-native application is way too different. Observability being the philosophy encloses monitoring, log aggregation, metrics and distributed tracing to gain deeper, ad-hoc insights into a system.
Stepping ahead with a convoluted approach by covering external scanning of the system, logs from the core offers good debug, custom metrics developed gives, and keeping an eye on requests will offer visibility, are the effective monitoring solution for an organization's cloud-native environment. The heart of cloud-native monitoring lies in the details and on the definite requirements which may change as per the maturity of an organization. Following the approaches similar to monitoring the maturity ladder model will leave no loopholes behind. Moreover, open-source tools like Prometheus, Fluentd, Kubernetes comes as an aid for the monitoring of cloud-native applications.
Subscribe
Related Blogs
Serverless vs Managed Services: Which One to Choose

When you decide to build an application in the cloud, you need to consider several factors. One of the most important…

Over the past few years, the cloud industry has gone through an extreme change with the transformation of serverless…
Putting The Serverless Trend Under a Microscope

Flexible. Scalable. Economical. These terms essentially sum up the advantages of serverless computing, an architecture that…


