
Cost of Invisible Work: CTO's Workforce Automation Guide
Most "workforce automation" content is written for HR teams automating payroll. None of it explains what a CTO actually needs: to know what a distributed engineering team is doing right now, not last Tuesday.
Ask that same CTO how the team is performing this sprint, and the honest answer usually starts with a pause. The work is almost always happening. The problem is that the picture of it is scattered across a dozen tools, half-updated boards, and a status meeting that reflects what was true two days ago rather than what is true now.
This gap between actual effort and visible effort has a name: invisible work. It is not a productivity problem. It is a visibility problem, and it quietly decides whether a delivery leader is managing by fact or by guesswork.
What is Workforce Automation?
Workforce automation is the use of connected software to track, measure, and forecast how a team's work is actually progressing, without relying on someone manually collecting and reporting that information. For a distributed engineering or delivery function, this means pulling live data from the tools already in use, such as Jira, GitHub, Slack, and Notion, into a single system that shows current status rather than a status from days ago.
This differs from how the term is used elsewhere. In HR and operations contexts, workforce automation usually refers to automating individual tasks, such as payroll processing or resume screening. For a CTO managing distributed delivery teams, the goal is different; it is to remove the manual effort of assembling an accurate picture of the team's work.
Why "Workforce Automation" Search Results Don't Help CTOs?
Search for workforce automation today, and most results talk about HR chatbots, payroll processing, or robots on a factory floor. That's useful if you run an HR function. It is not useful if you are a CTO or delivery lead trying to see what a distributed engineering team is actually doing right now.
For this audience, workforce automation means something more specific: turning fragmented signals from tools like Jira, GitHub, Slack, and Notion into one real-time picture of how work is progressing, and using that picture to forecast timelines, spot problems early, and keep global teams aligned without adding more meetings.
Measuring the Problem: What DORA Metrics Reveal About Invisible Work
Before fixing a visibility problem, it helps to measure it properly. DORA metrics (DevOps Research and Assessment) were developed by a research team inside Google Cloud after studying delivery performance across thousands of organisations over several years.
The research, led by Dr. Nicole Forsgren, Jez Humble, and Gene Kim, identified four measurements that predict software delivery performance and organisational outcomes. These four metrics are widely used by engineering organisations to benchmark how well a team ships software, and each one depends entirely on the accuracy of the data behind it.
- Deployment Frequency: The number of deployments over a given period, or the time between them. A team assembling this number by hand from memory or scattered logs will produce a figure that lags reality.
- Lead Time for Changes: How long it takes for a commit to reach production. This depends on visibility across every stage between commit and release, which is exactly where invisible work hides.
- Change Failure Rate: The percentage of deployments that cause a failure in production. Without connected data, this number is often discovered late, after the failure has already caused disruption.
- Time to Restore Service: How long it takes to recover from a deployment that fails and requires immediate intervention. Recovery time depends on how quickly a team can see what went wrong, which is a visibility problem before it is a technical one.
These four metrics only mean something if the underlying data is current and complete. Invisible work does not just hide effort from a manager. It corrupts the very metrics leaders use to judge whether delivery is healthy. Workforce automation, in this context, is what keeps DORA metrics trustworthy by sourcing them directly from the tools where work happens, rather than from a status update assembled after the fact.
A Maturity Model For Delivery Visibility
Not every organisation has the same visibility problem, and it helps to know its digital maturity before choosing a fix. A simple four-stage model works well here:
| Stage | What it Looks Like | Primary Risk |
|---|---|---|
| Manual | Status comes from standups, spreadsheets, and memory | Reporting always reflects the past |
| Reactive | Tools like Jira and GitHub are used individually, checked when something looks wrong | Problems are found only after they've already caused delay |
| Connected | Tools are integrated into a shared dashboard, but forecasting is still manual | Visibility exists, but prediction doesn't |
| Predictive | Historical velocity data feeds forecasting, and bottlenecks are flagged automatically | Requires governance discipline to avoid data overload |
Most organisations sit somewhere between Manual and Reactive without realising it, largely because each tool feels well-managed in isolation. The jump that actually changes outcomes is from Reactive to Connected, since that's the point where a leader stops assembling the picture by hand.
Why Manual Fixes Stop Scaling for Distributed Teams?
Most organisations try to solve this with more process rather than better visibility, and that approach works fine until a team grows or spreads across time zones.
Daily standups are a good example. They work well for a single co-located team, but they break down once contributors are spread across multiple regions and can't all join the same call. Spreadsheet trackers have a similar problem: someone has to update them manually, which means they are almost always a few hours or days behind reality. Status meetings run into the same wall, because by design they report on the past rather than the present. And when core tools like Jira, GitHub, and Slack are used in isolation, with nobody manually stitching the data together, there is no single place anyone can look to get the real picture.
What Real Workforce Automation Looks Like for Engineering Delivery
For an engineering or delivery function, workforce automation isn't about replacing people with software. It's about giving the people already doing the work a shared, live picture of what's happening.
- Sync: Automated data sync connects tools like Jira, GitHub, Slack, and Notion so information updates continuously rather than on someone's schedule.
- Signal: Live dashboards translate raw activity into a status that reflects the current moment, not last week's report.
- Forecast: Velocity-based forecasting uses a team's own historical output, rather than optimism, to predict whether a deadline is realistic.
- Govern: Role-based visibility determines who sees what, and is covered in more depth in the next section.
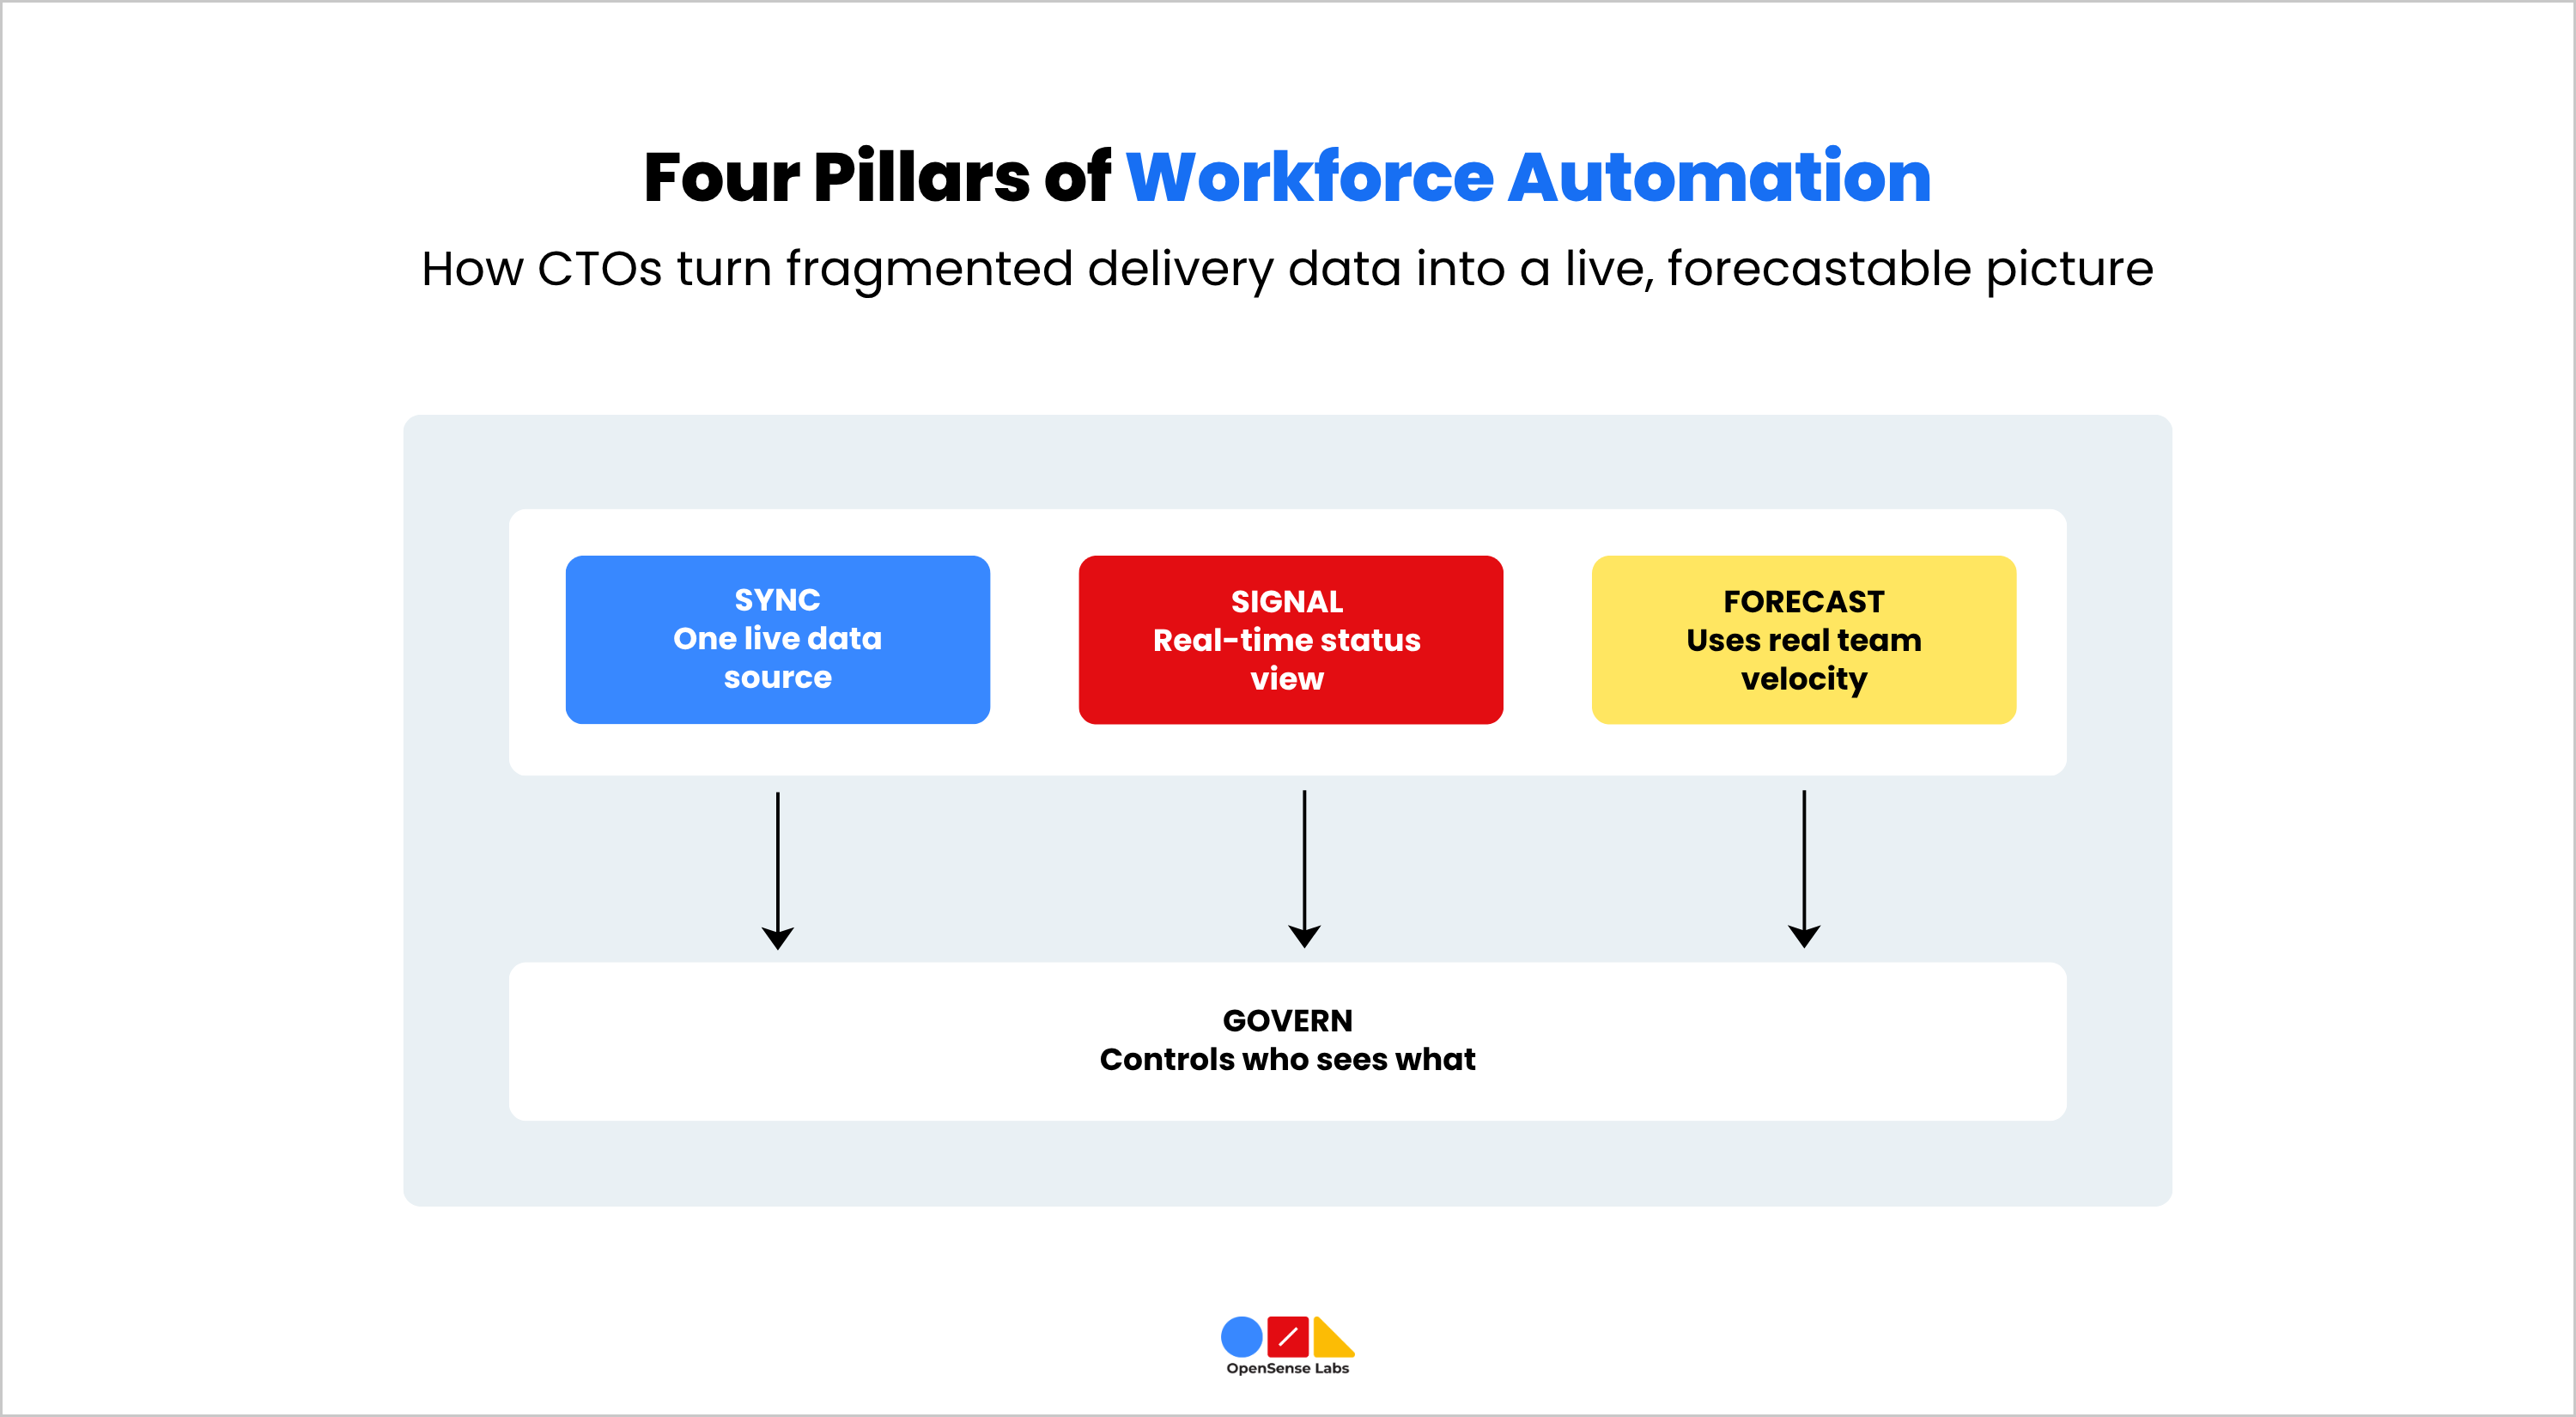
Once Sync, Signal, and Forecast are in place, the practical shift for managers is that they stop reacting to problems once they've already caused damage. Bottleneck flagging surfaces stalling work while it's still a small delay, which means resources can be rebalanced proactively rather than after a deadline is already at risk.
Governance Across Distributed and Global Teams
Visibility only helps if the right people see the right information, and this matters even more once teams span multiple regions, vendors, or client organisations. A workable governance model usually rests on three decision criteria.
Role-based access decides who sees what: an engineering lead needs granular detail, while a client stakeholder typically needs only outcome-level status. Client-facing transparency decides how much of that detail crosses the organisational boundary. External stakeholders benefit from clear, consistent updates, but they don't need to see internal operational noise such as individual task reassignments or day-to-day friction. Audit-ready logging determines how defensible the record is after the fact, since every status change and update being captured automatically produces a trail that holds up for internal reviews and client-facing accountability alike, without anyone needing to have documented it by hand.
What to Evaluate in a Workforce Automation Solution
Not all workforce automation approaches are built the same way, and the differences matter once an organisation is relying on one for real delivery decisions.
| What to Look for | Why it Matters |
|---|---|
| Tool-agnostic integration | It should connect to the stack already in use - Jira, GitHub, Slack, Notion - rather than requiring a replacement |
| Real-time over batch sync | Data that updates live prevents the reporting lag that causes most of the problems above |
| Transparent forecasting methodology | Leaders should be able to see how a prediction was calculated, not just trust a number |
| A defined governance model | Role-based permissions keep sensitive project data visible only to the right people |
| Fast time-to-value | A solution that takes months to configure delays the benefit it's meant to deliver |
In summary
Invisible work is a visibility problem before it's anything else, and it costs organisations time, trust, and forecasting accuracy long before it shows up as a missed deadline.
It also quietly undermines even well-established performance frameworks like DORA metrics, since those metrics are only as reliable as the data feeding them. Most content on workforce automation focuses on HR and operations use cases that don't reflect what engineering and delivery leaders actually need.
Real workforce automation for this audience means connecting the tools already in use into one live, honest picture of how work is progressing, so leaders can plan, govern, and course-correct with facts rather than guesswork.
Turning that picture from words into practice requires the right infrastructure. OpenSense Labs builds exactly this for distributed engineering and delivery teams, unifying the tools already in place into one connected system, with forecasting and governance built in from the start.

Newsletter abonnieren
Open-Source-Technologie begeistert Sie? Bleiben Sie mit Projekten auf dem Laufenden, die einen Unterschied machen.